

Analyze Blockchain and DeFi data in minutes with SQL and Dune Analytics: A Quickstart Guide


Table of contents
We can't seem to get away from the buzzword "blockchain." It is associated with the decentralized finance industry, NFTs, bitcoin, and cryptocurrencies. One characteristic that makes blockchain technology appealing is its distributed ledger system, which is immutable and authentic. Every transaction record is verified and stored by a distributed network that anyone can access. Although everyone can access this data, analyzing it isn't friendly for the average person because it requires some technical knowledge.
Dune Analytics strives to tackle this issue. Dune analytics makes blockchain analysis relatively easy. This article will cover an introduction to Dune and how you can use it to analyze blockchain data. However, before we get started, let's explain some terminologies.
Breaking down the Terms
Blockchain is a decentralized, distributed, write-only chain of blocks (records) linked by cryptography.
Cryptography makes it easy to verify the transaction's owner (digital signature) and block's integrity (hash). Some other capabilities of blockchain technology include the hash function, Merkle tree, Proof of work (PoW), and public-key encryption. All of these characteristics combine to make blockchain encryption immutable, authentic, distributed, and a decentralized database.
In the financial industry, blockchain technology is used to exchange and buy cryptocurrencies like Bitcoin, Ethereum, and Dogecoin. These transactions take place on either a centralized (Binance) or a decentralized (Airswap and Uniswap) exchange.
NFTs are yet another application of blockchain technology. Non-fungible tokens, or NFTs, are unique digital assets. You can tell a fake asset from the real or original by its digital signature. The blockchain distributed ledger technology validates, archives, and records every NFT trade, creation, or crypto transaction that takes place. This transaction record (data) cannot be altered and is available to the public.
While this is great, knowing how to interpret blockchain data is very important for monitoring and obtaining insight. This, however, is not a simple procedure. But with the Dune Analytics platform, analyzing any cryptocurrency, blockchain ecosystem, or NFT project becomes simpler.
This tutorial will explain how to use Dune Analytics to analyze blockchain data in only a few steps:
- Signing up on Dune
- Getting data
- Querying data
- Visualizing your data
- Creating a dashboard
What is Dune Analytics?
Dune Analytics is a data querying platform that allows everyone to query data from blockchain projects and domains such as NFTs and DeFi, and visualize the results.
Simply put, Dune makes it simple for crypto users to turn blockchain data into insights, charts, and analytics.
How does Dune Analytics work?
Dune Analytics aggregates and parses public blockchain data in a queryable PostgreSQL database. PostgreSQL is a powerful open-source relational database that enables querying in both SQL and JSON formats. It's also known for its resilience, authenticity, and integrity. A vast amount of blockchain data can be queried with this database.
Currently, Dune supports Ethereum, Polygon, Optimism, and Binance Smart Chain data.
Getting started with Dune Analytics
You'll need to know how to query data using SQL to get started with blockchain analysis on Dune. SQL (Structured Query Language) is a database access and manipulation programming language. Thankfully, SQL is a relatively easy language to pick up. The next step is to learn more about the blockchain ecosystem so that you can better understand your data.
Finally, you must sign up on Dune and create an account to have access to the Dune Analytics platform. You'll get free access to a variety of blockchain data, as well as the ability to search, query, and visualize it. A paid subscription with additional perks is available, but for this tutorial, a free membership will serve.
Dune Analytics Interface
Welcome to Dune!
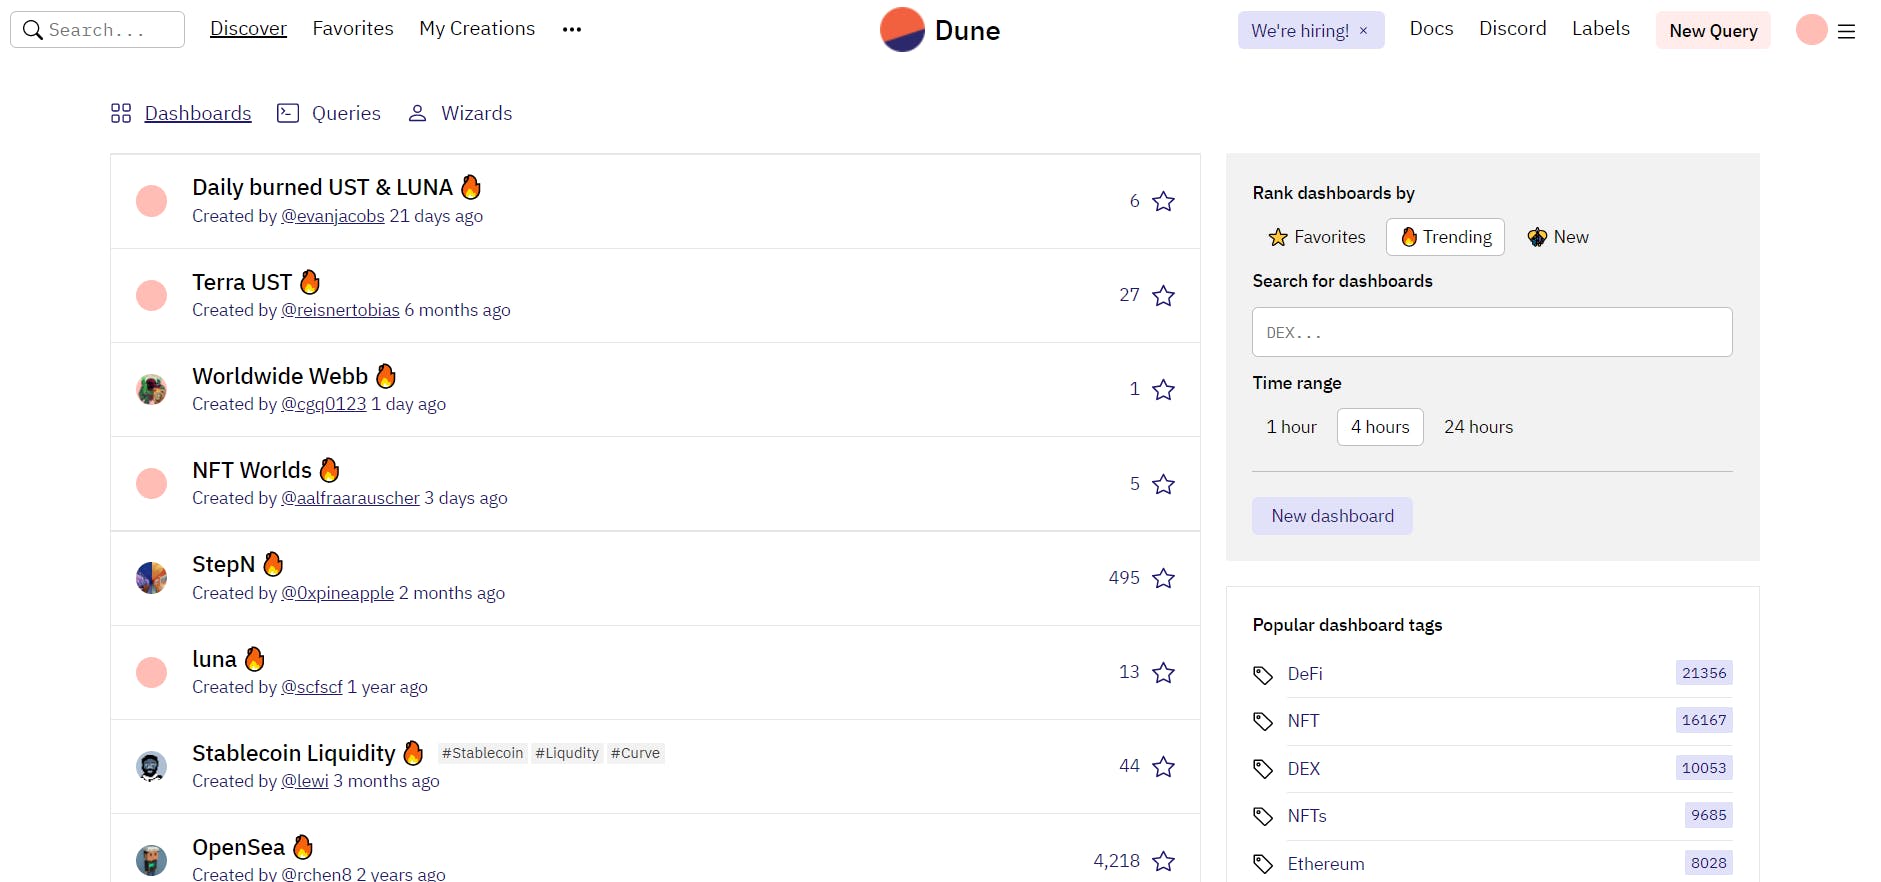
After signing up for sign up, you get an overview of the trending dashboards.
A dashboard is a collection of all of your graphs. A dashboard is created by combining your charts. You can look for published dashboards by typing the name of the DeFi project, cryptocurrency, and Ethereum transactions into the search bar. The name of the dashboard is displayed alongside the name of the analyst or publisher and the star score.
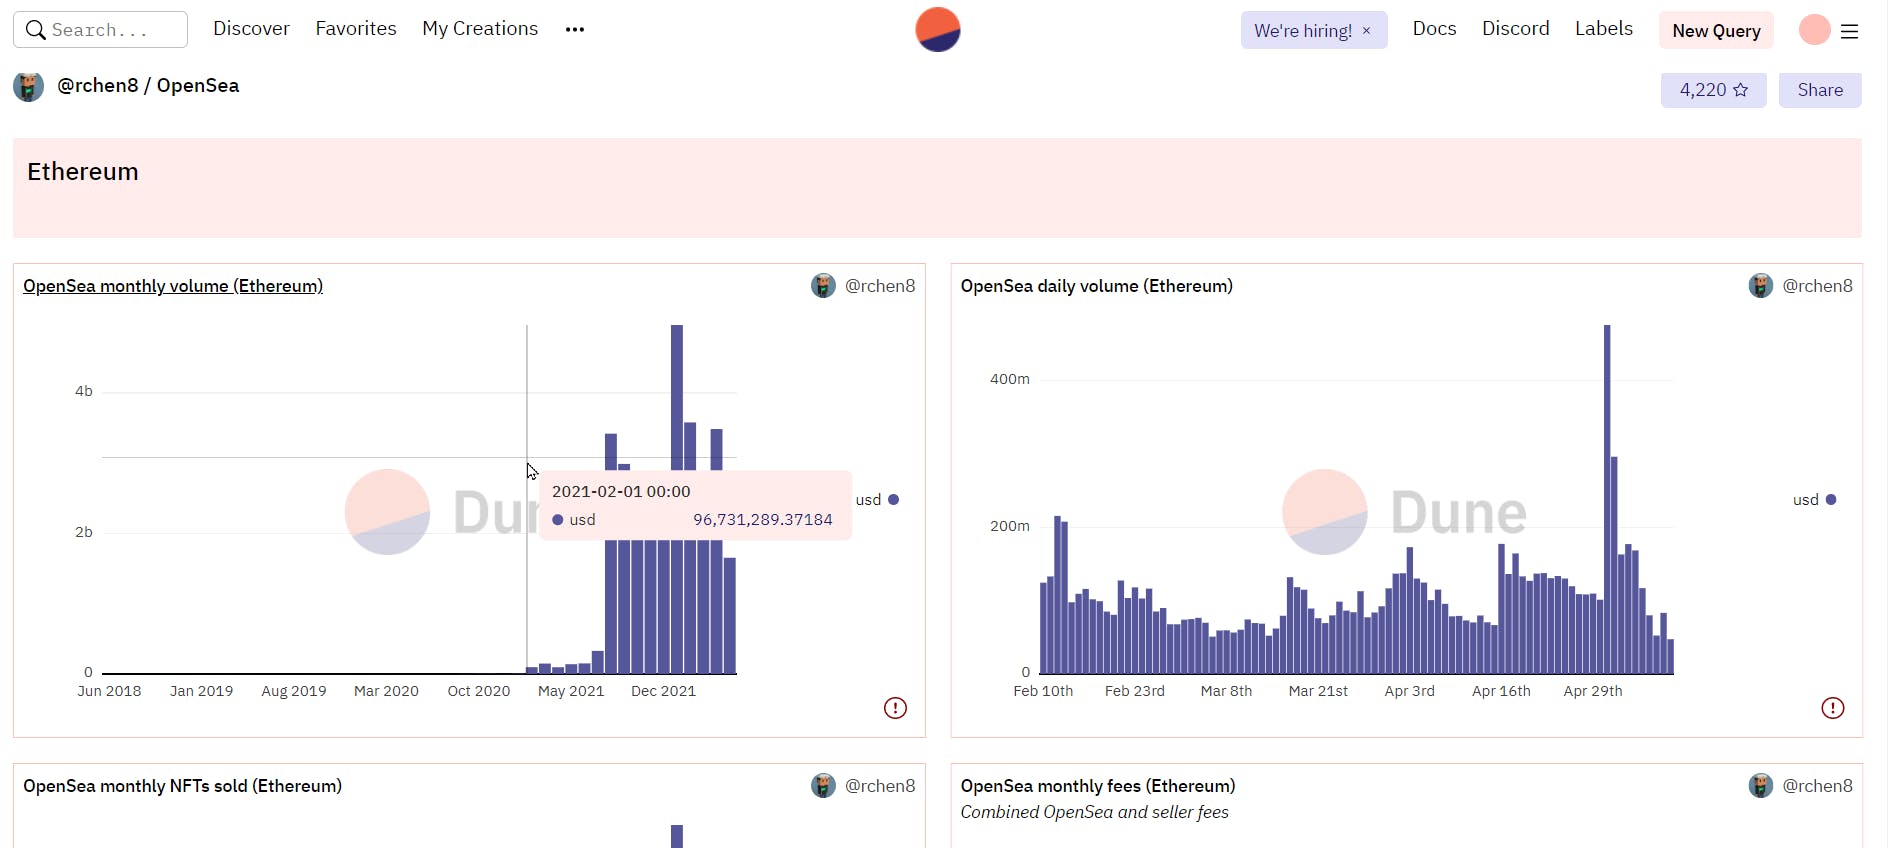
You will be taken to the dashboard homepage if you click on a published dashboard. This will display the dashboard's visualizations along with metric details if you hover over the chart. To see the query, click on the chart title.
Querying Blockchain or DeFi Data with Dune Analytics
To analyze blockchain data, the first step is to click on "New Query" at the top right corner of your screen. This will lead you to the querying screen.
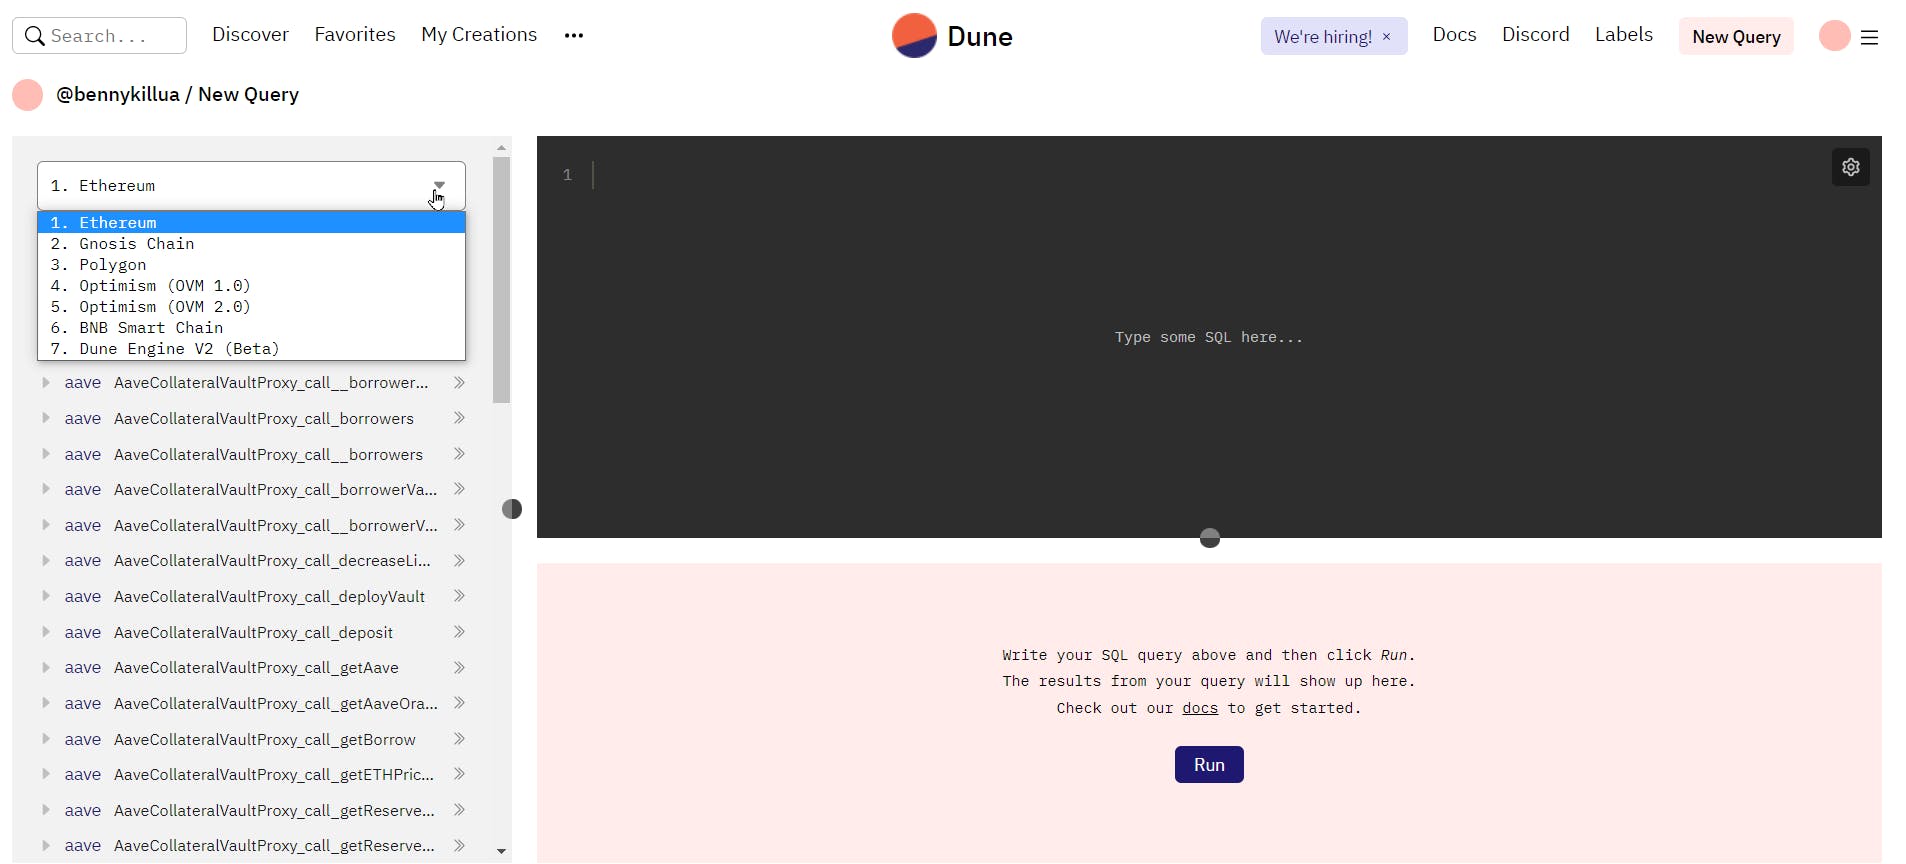
On the left, a list of existing SQL tables from Ethereum, Gnosi chain, Polygon, Optinism (OVM 1.0), Optinism (OVM 2.0), BNB smart chain, and Dune engine V2 (Beta) blockchains are displayed. You can build your query from this table and you can write your SQL query in the editor in the middle. We're going to look into Ether (ETH) in this tutorial.
Ether is the Ethereum blockchain's native token. It can also be used to pay for transactions and as collateral for a loan. We'll begin by analyzing Ethereum.blocks.
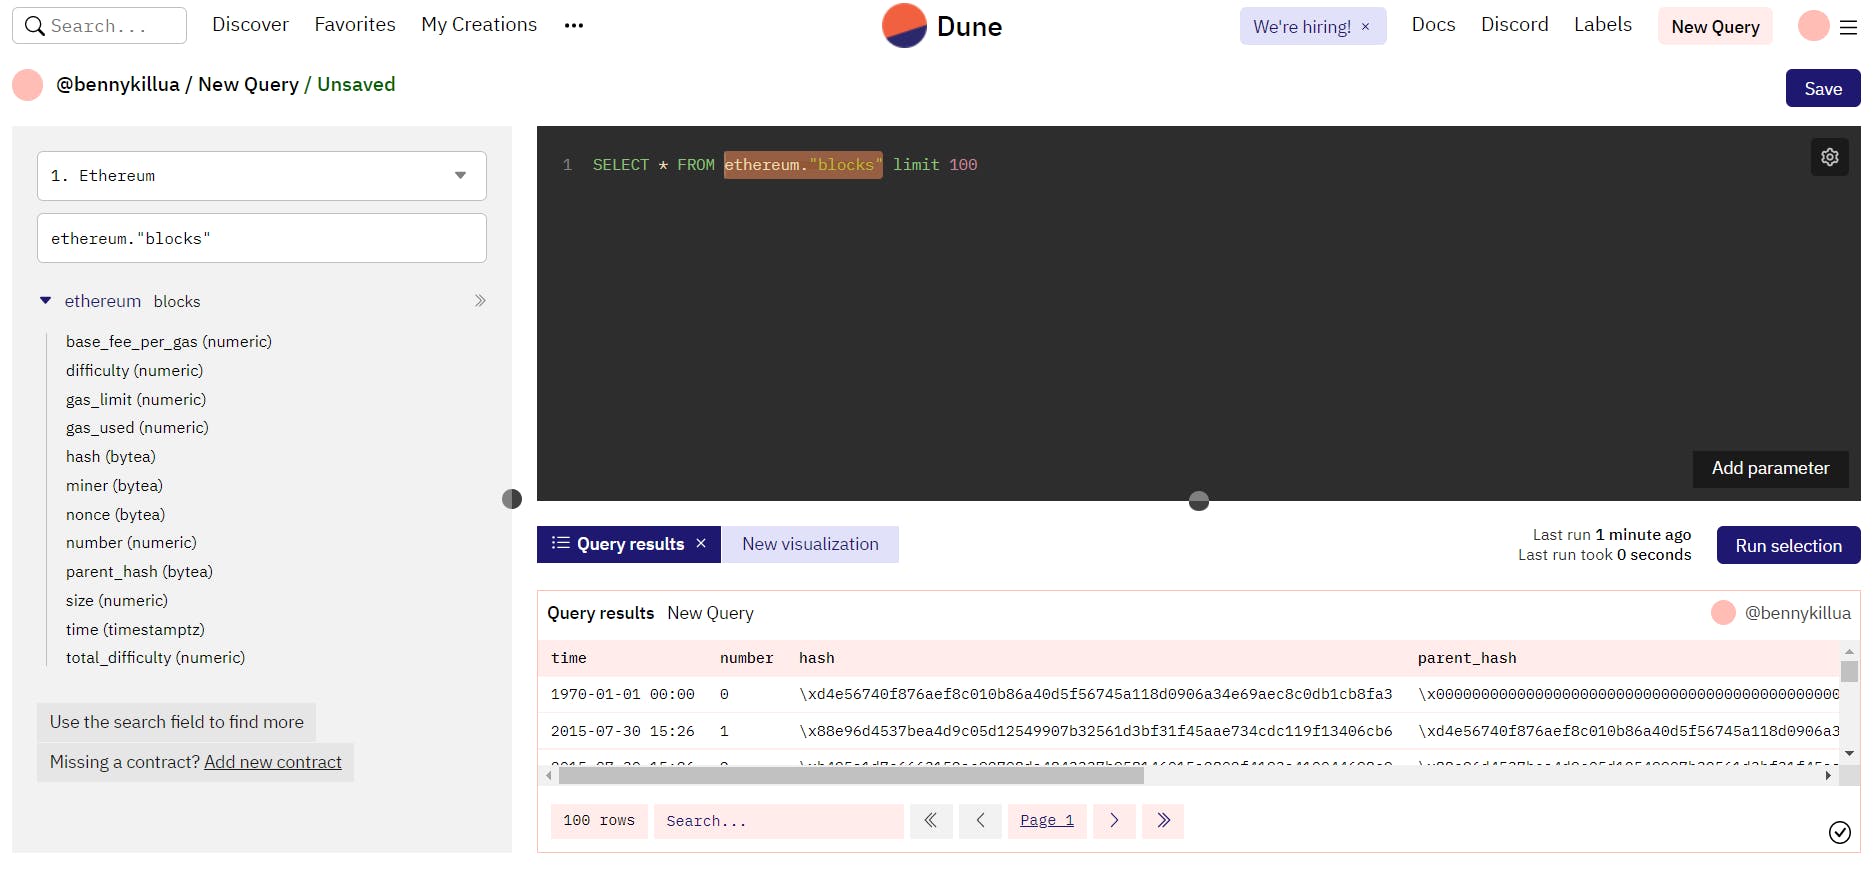
Search for Ethereum.blocks in the search box. Next, analyze the Ethereum.blocks data by running the following command on your query editor.
SELECT * FROM ethereum."blocks" limit 100
Because running all of the data on Ethereum.blocks will take a long time, we used the LIMIT clause to display just the first 100 rows. The resulting query will return a table with all the available columns, including time, hash, and parent hash.
Here’s what the final output looks like:
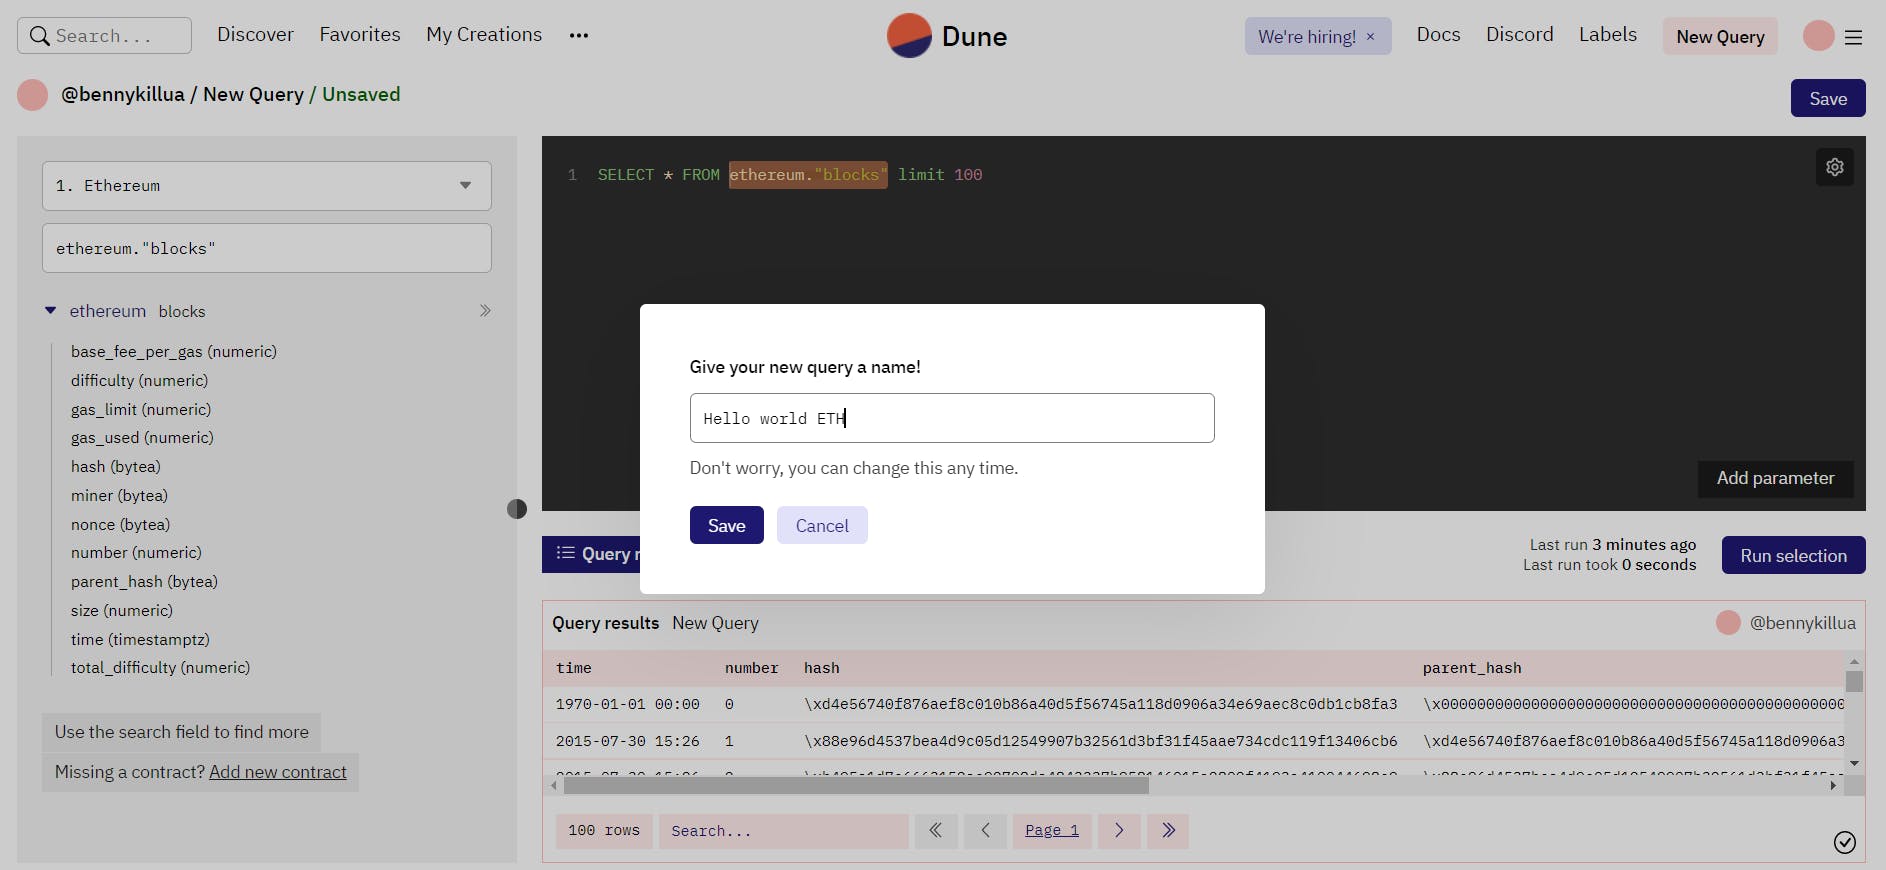
Save your query and give it a name.
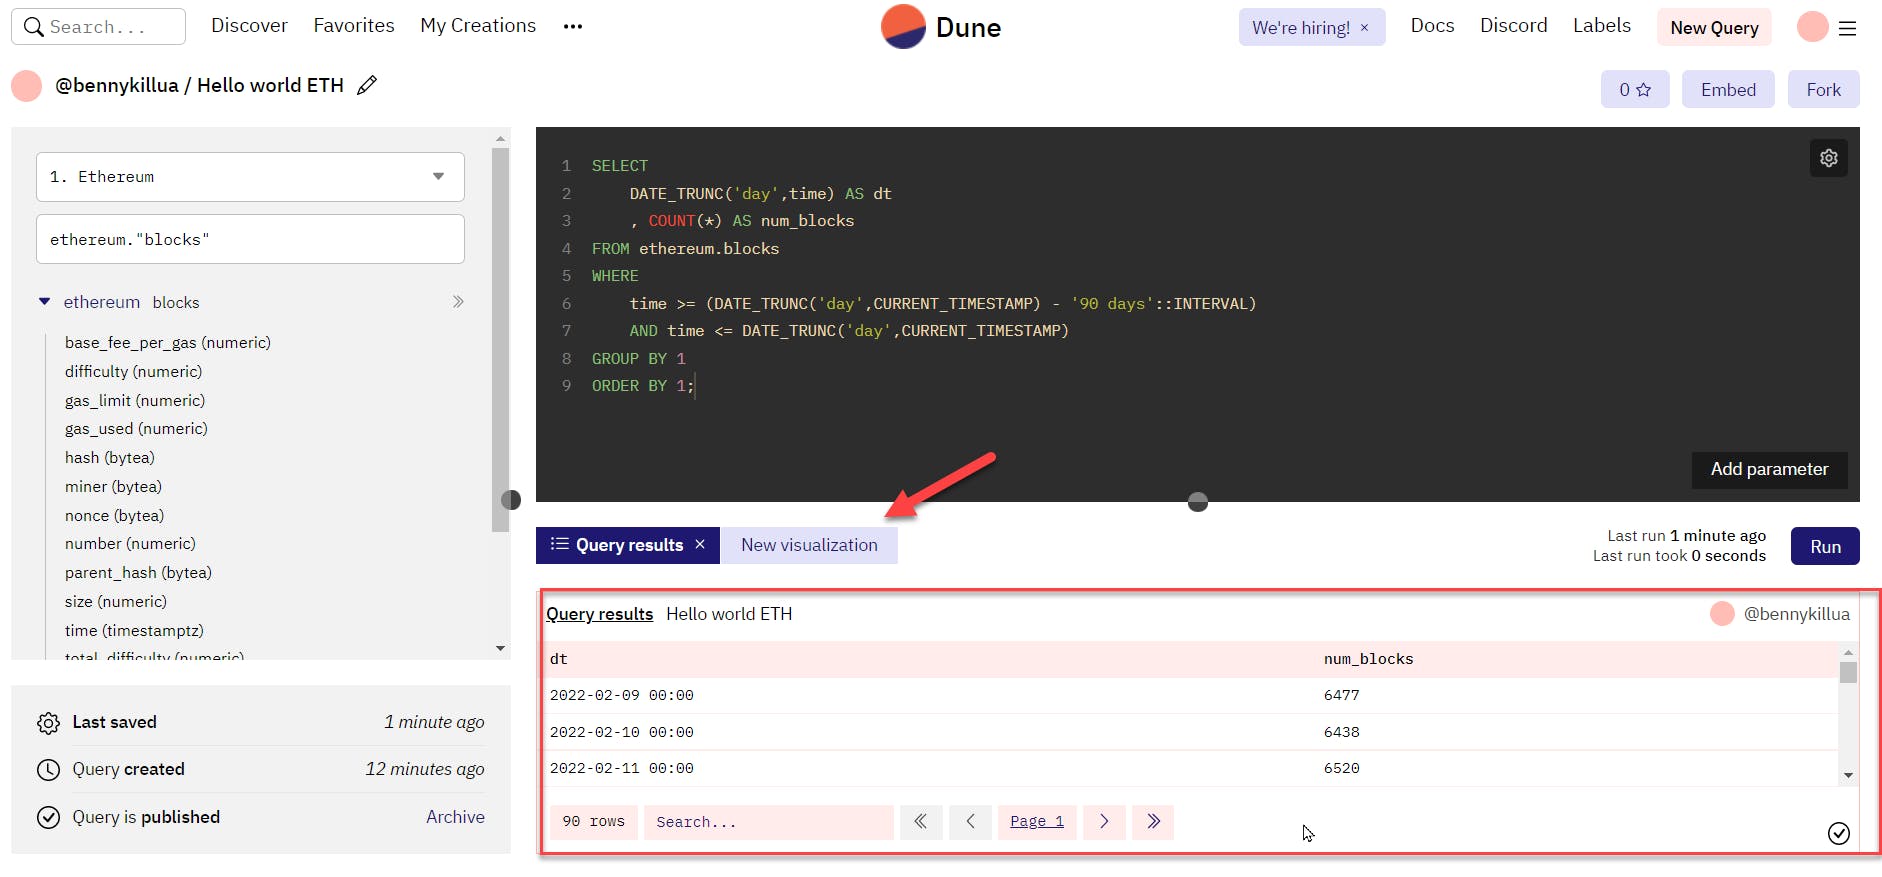
Let's have a look at a little more complex query. This time, we want just the number of blocks for the last 90 days. We get this by running this query:
SELECT
    DATE_TRUNC('day',time) AS dt
    , COUNT(*) AS num_blocks
FROM ethereum.blocks
WHERE
    time >= (DATE_TRUNC('day',CURRENT_TIMESTAMP) - '90 days'::INTERVAL)
    AND time <= DATE_TRUNC('day',CURRENT_TIMESTAMP)
GROUP BY 1
ORDER BY 1;
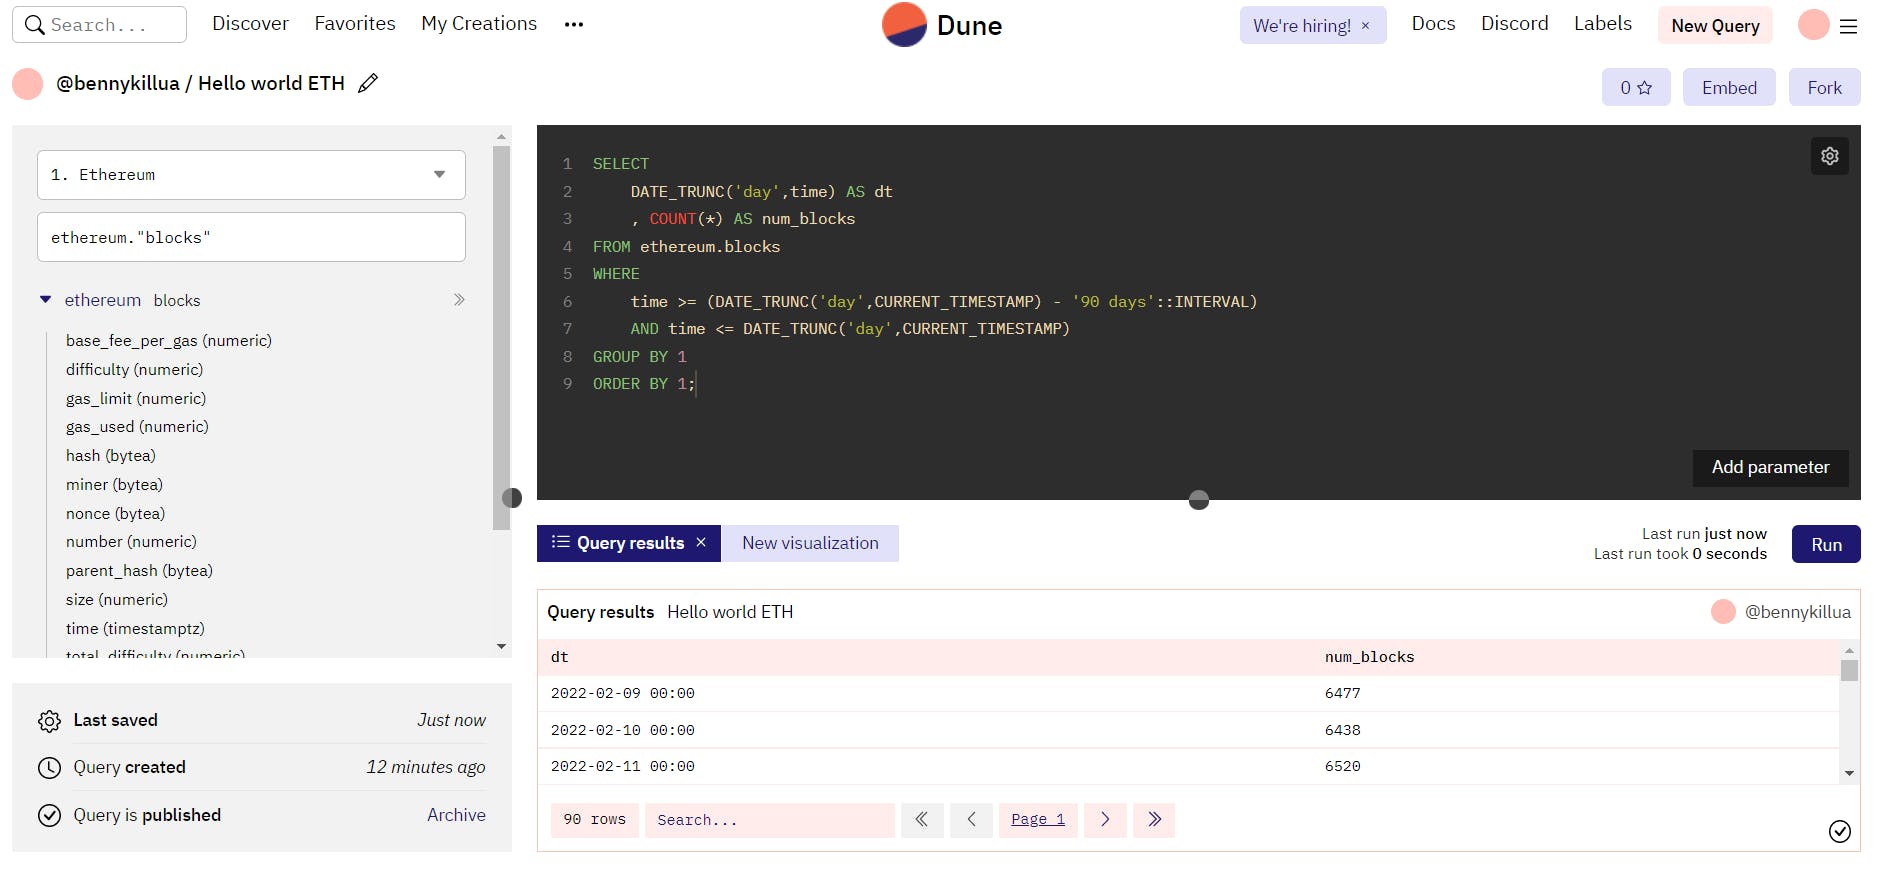
So, how does this query accomplish that?
We used the SELECT statement to select only the columns we require: "time". Then the date trunc('day', time) allows us to categorize our time in days while using the COUNT clause to count the number of blocks for each day. The ASallows us to give these new columns an alias name. Finally, we used the GROUP BY and ORDER BY functions to group and order our results based on the first column in our query, which is our date. visit this link to view the query.
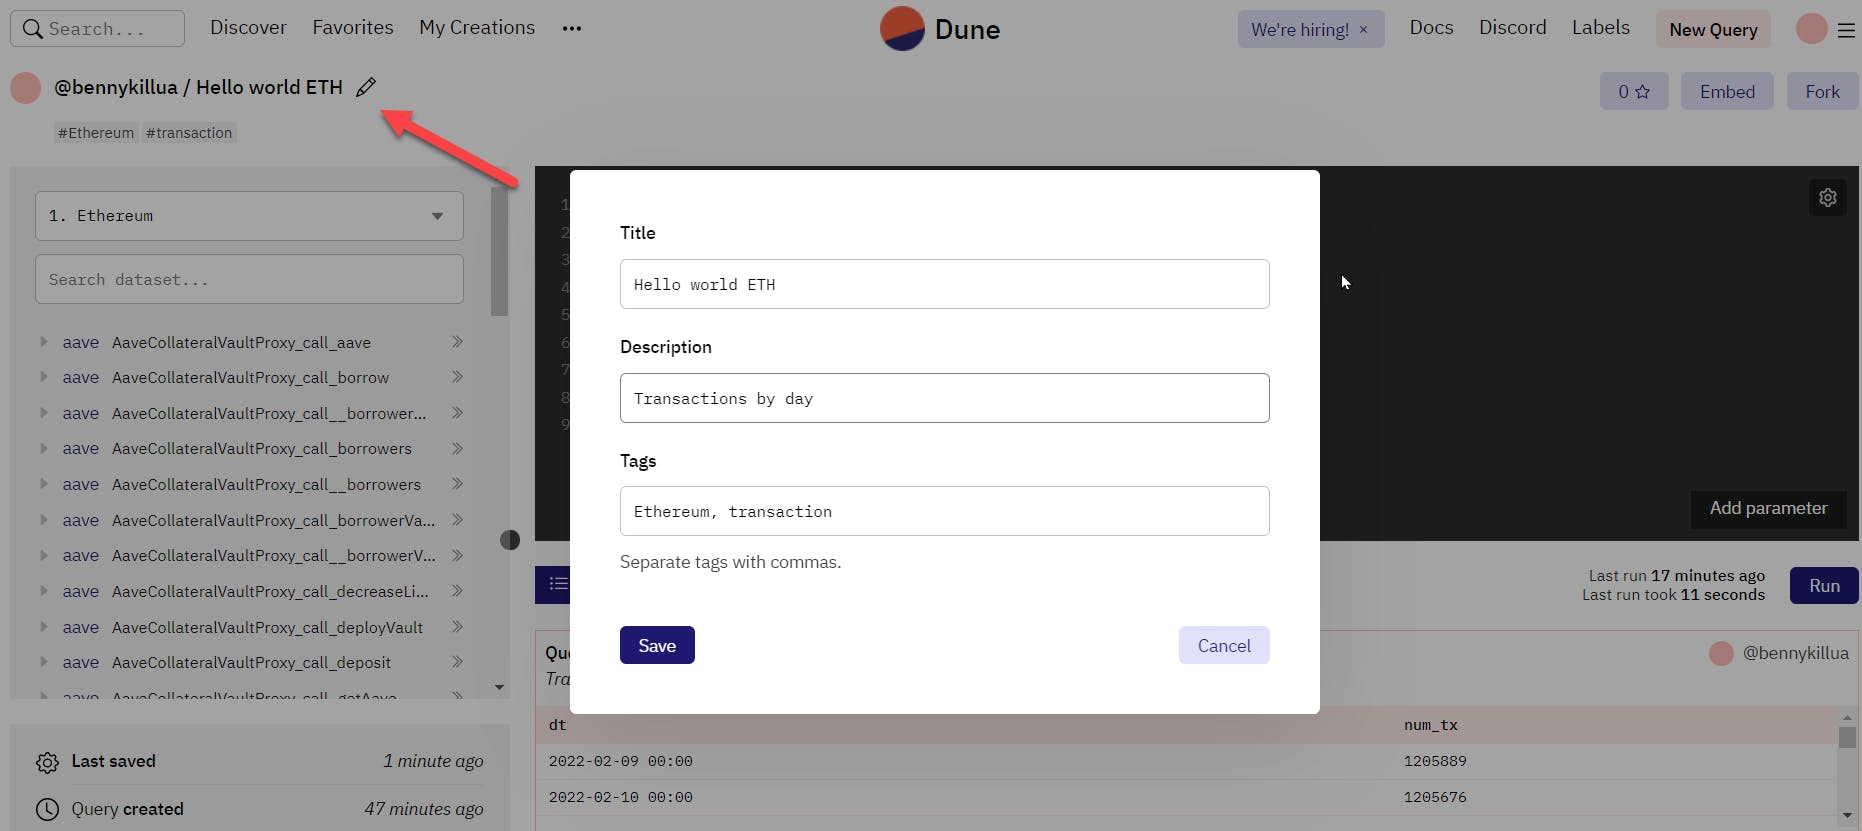
After that, we must save our query. By clicking the edit icon next to the name, you can edit and add a description of your query after saving.
Visualizing Blockchain or DeFi Data with Dune Analytics
Dune understands the importance of data visualization; it makes data easier to read. By clicking "New Visualization" on Dune, you can create a chart. You'll be asked to select the type of chart you want. This can be a bar, area, scatter, line, or even a pie chart.
Let's go with a line chart in this scenario.
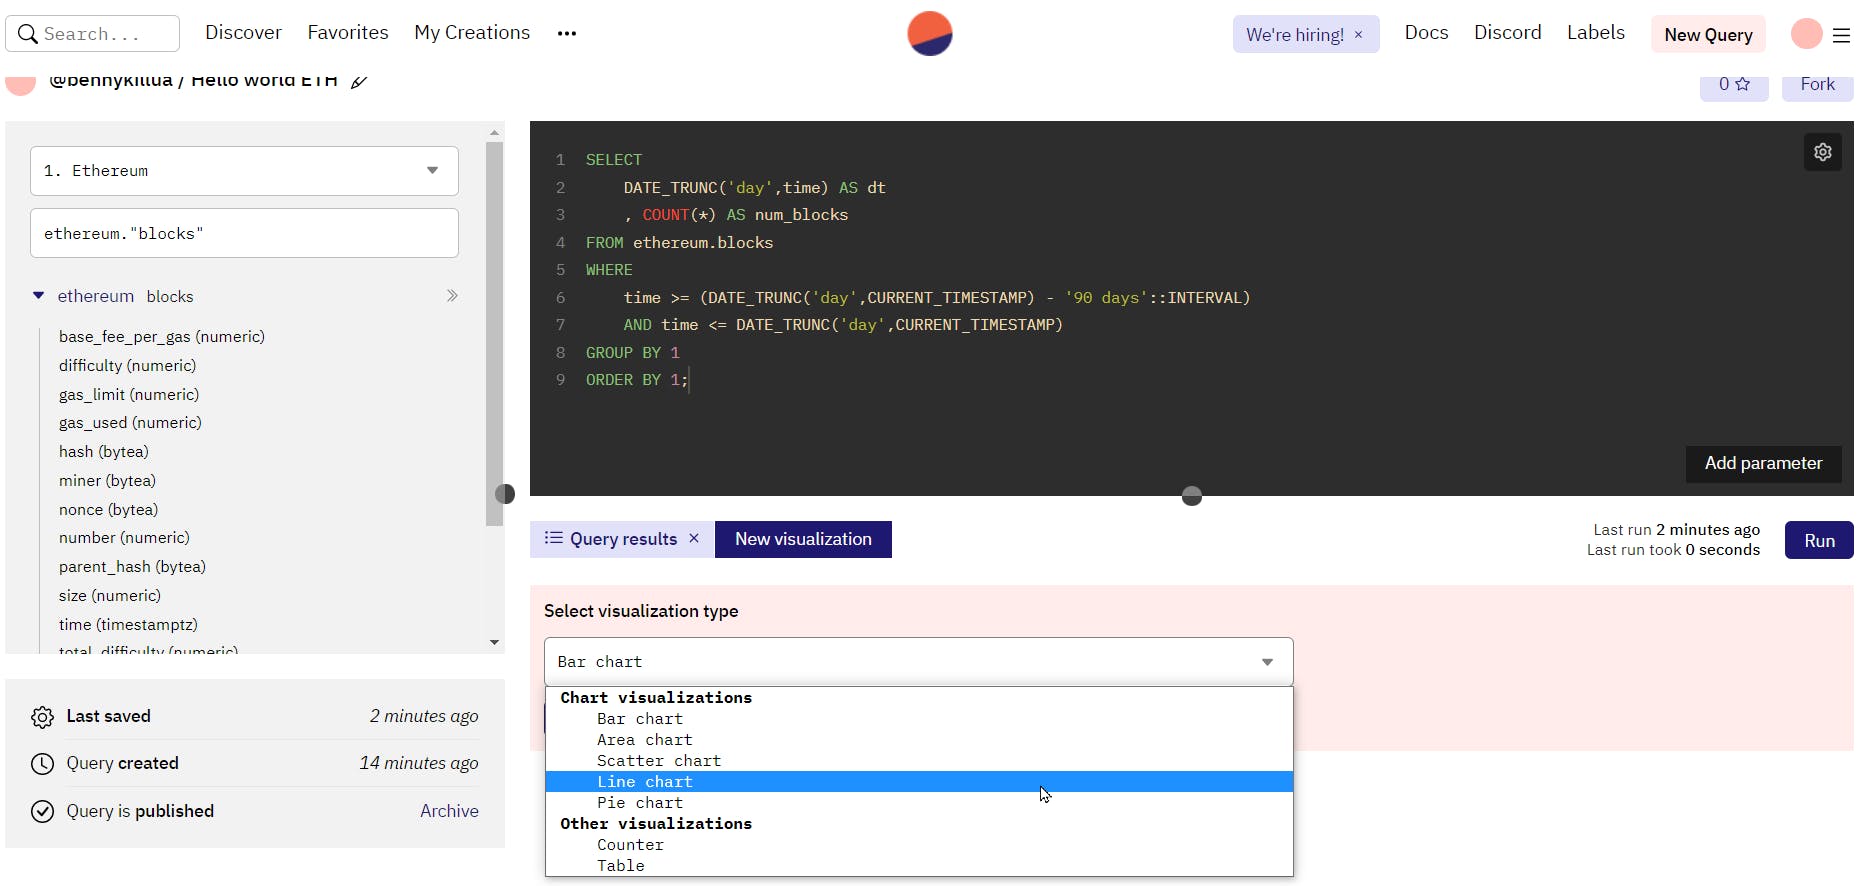
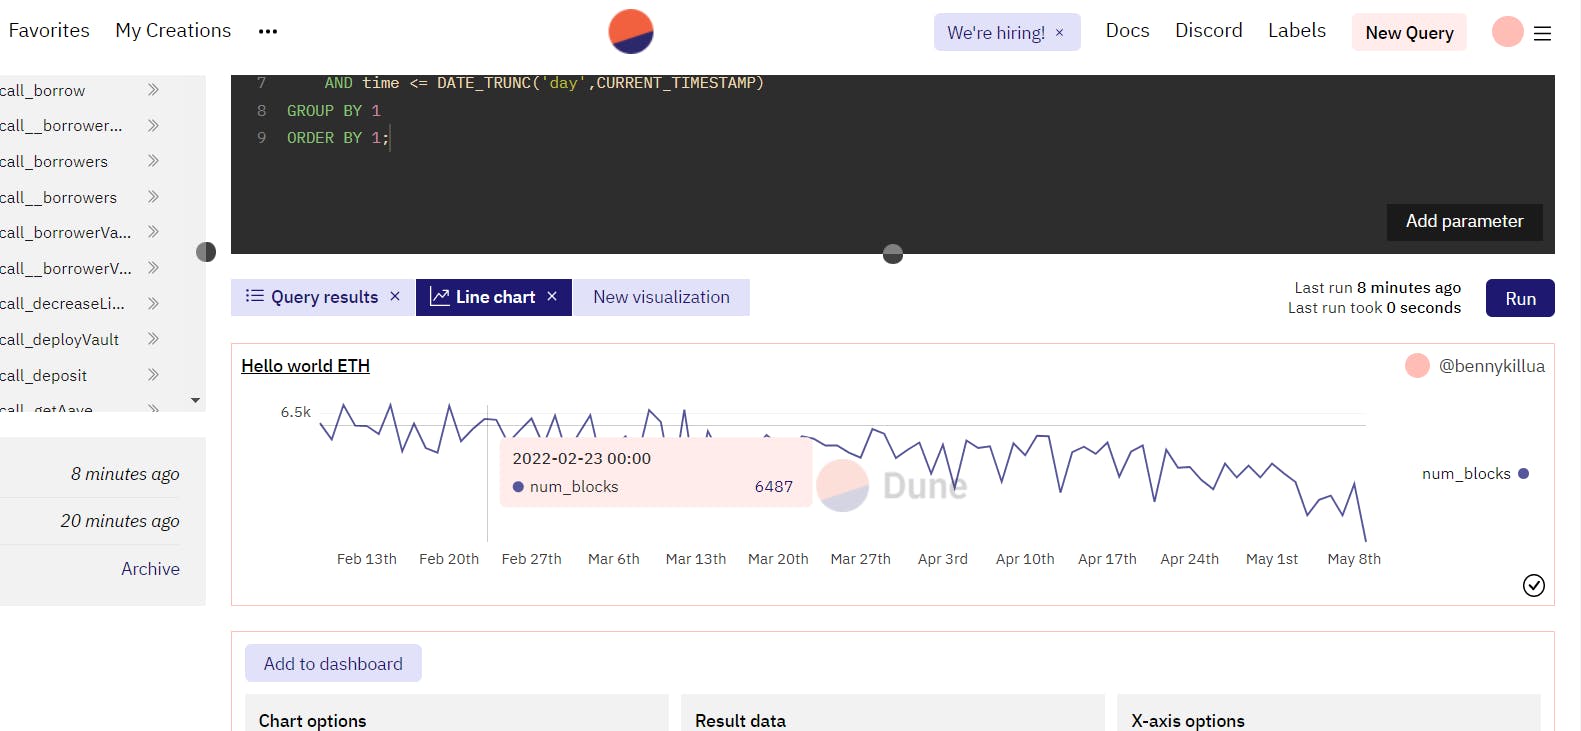
A line chart would be ideal for this scenario since we are working with time.
This is what the final output will look like:
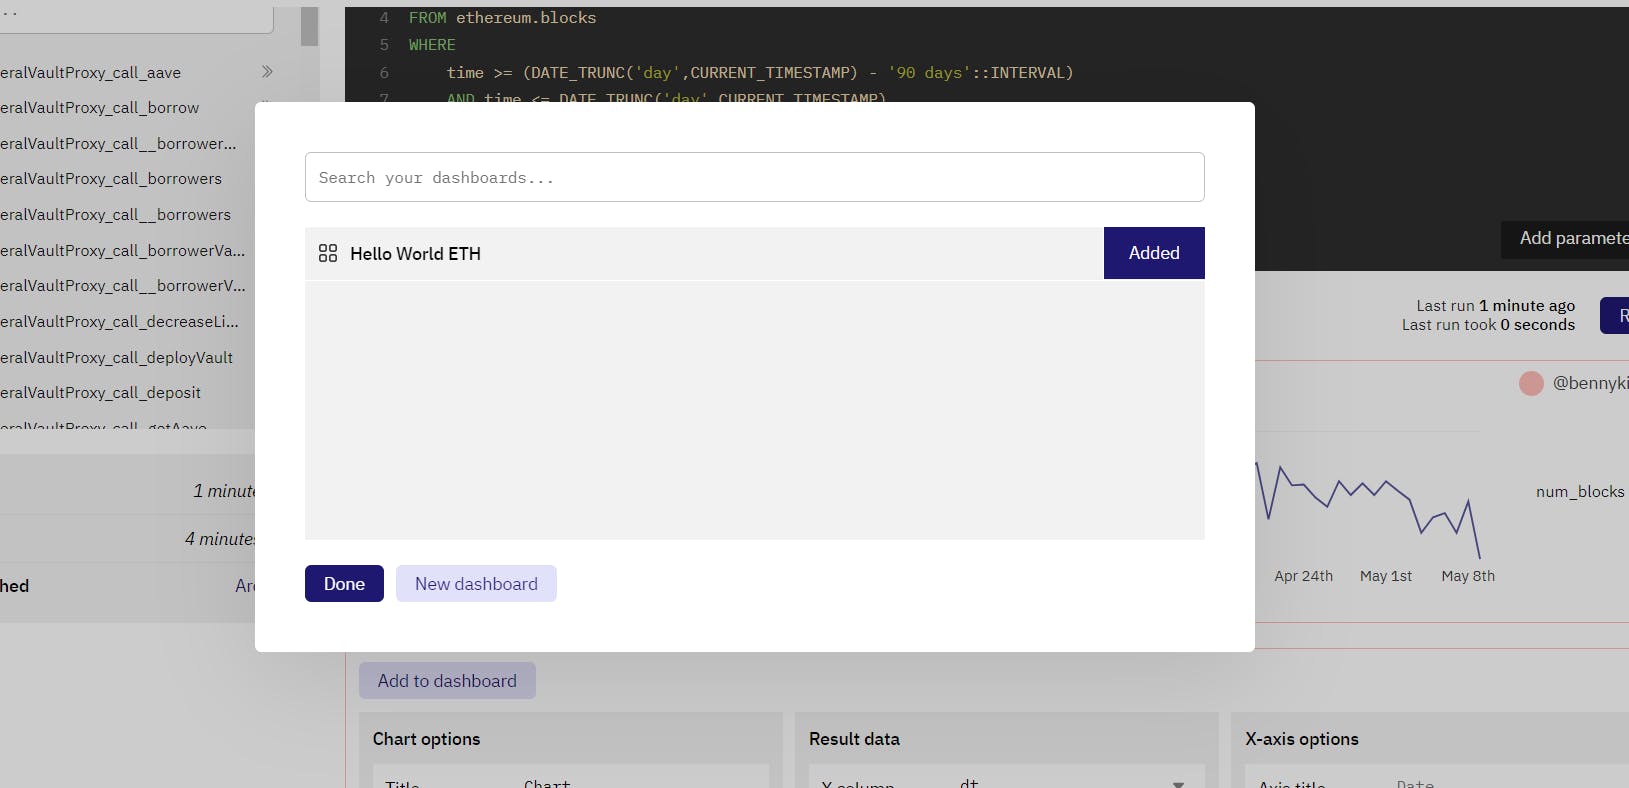
To add this visual to a dashboard, go to the bottom of the page and select "Add to Dashboard". Give your dashboard a name and save it.
Dune Dashboard
A dashboard is just a collection of charts that display your key metrics. You can create one by inserting various charts into it. Let's create a new query and visualize it.
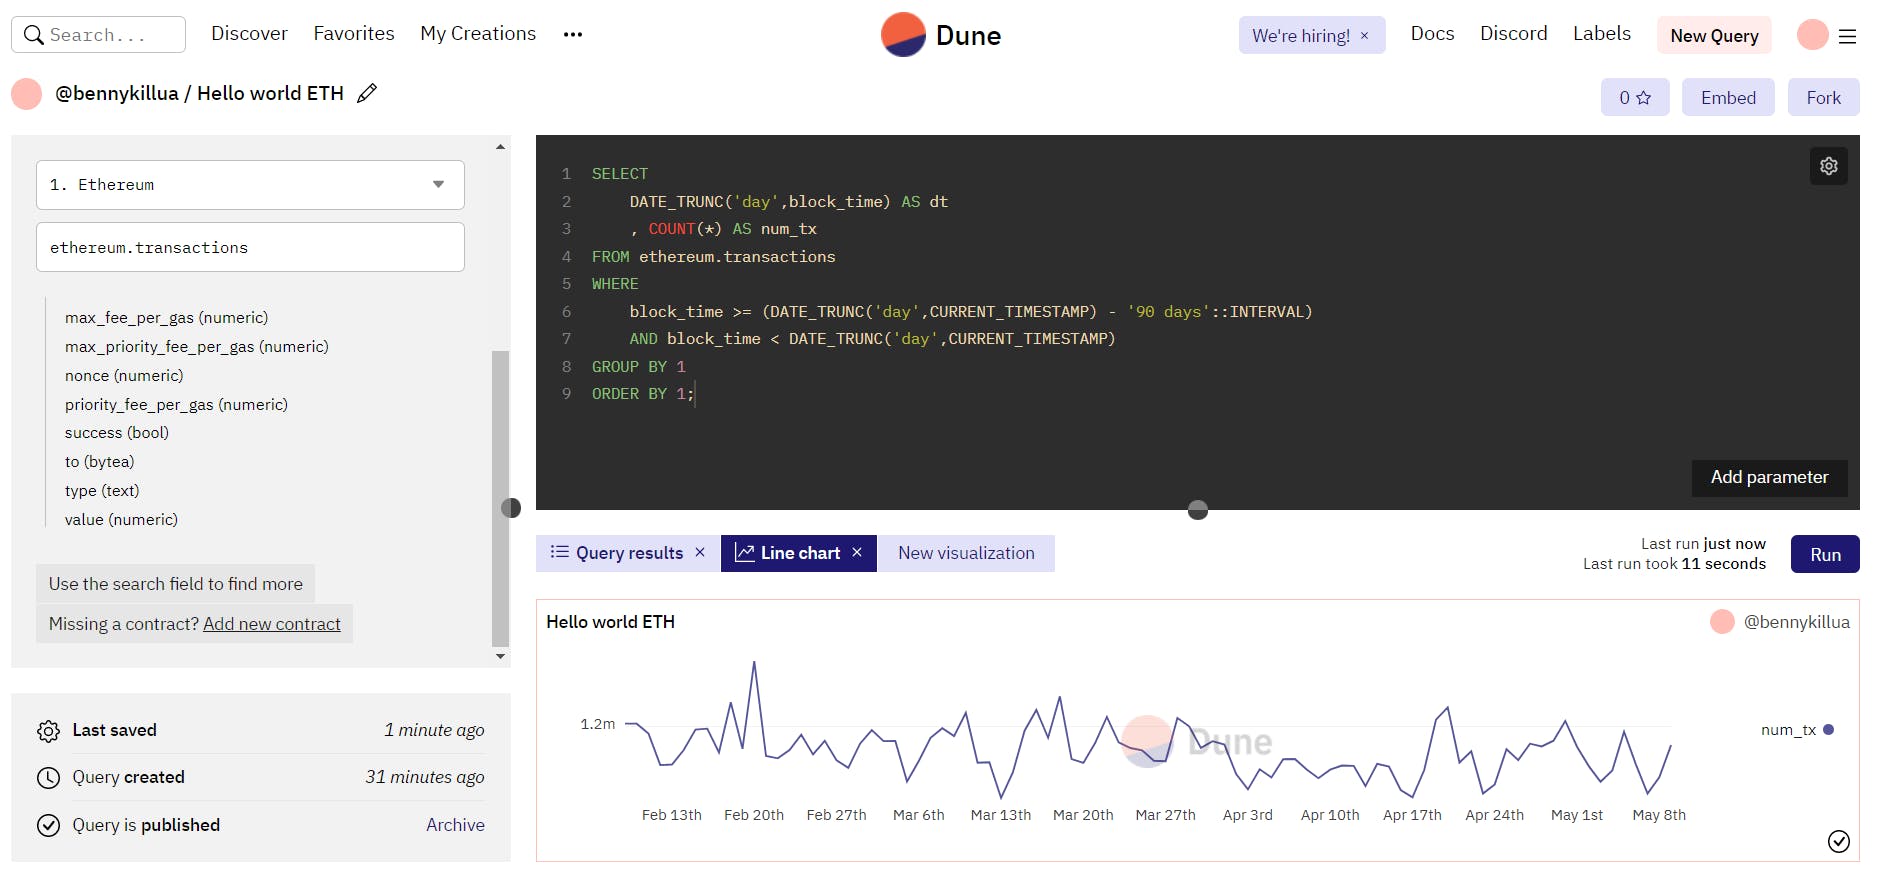
Select "New query" and search for ethereum.transactions this time. Next, we'll write a query to get the total number of transactions in the last 90 days.
Run and save the query below:
SELECT
    DATE_TRUNC('day',block_time) AS dt
    , COUNT(*) AS num_tx
FROM ethereum.transactions
WHERE
    block_time >= (DATE_TRUNC('day',CURRENT_TIMESTAMP) - '90 days'::INTERVAL)
    AND block_time < DATE_TRUNC('day',CURRENT_TIMESTAMP)
GROUP BY 1
ORDER BY 1;
Visit this link to view the query.
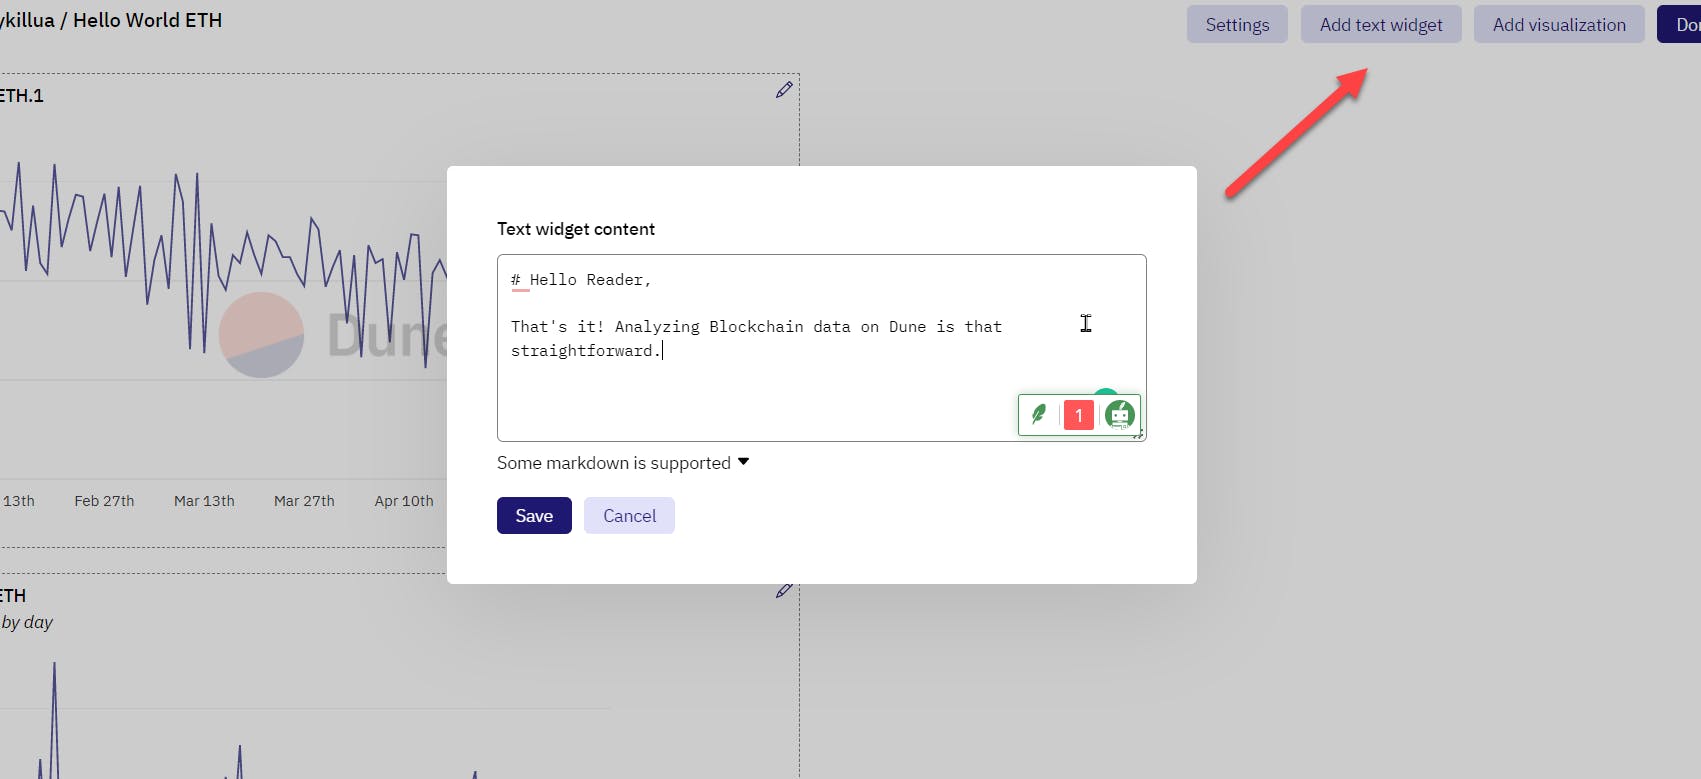
Once the query has been executed, Let's add another line chart. Let's add this visualization to the dashboard. Click on "My Creation" in the top right corner of your navigation pane to see your dashboard. After that, click on your dashboard name. This will display your dashboard. You can add a text widget on your dashboard.
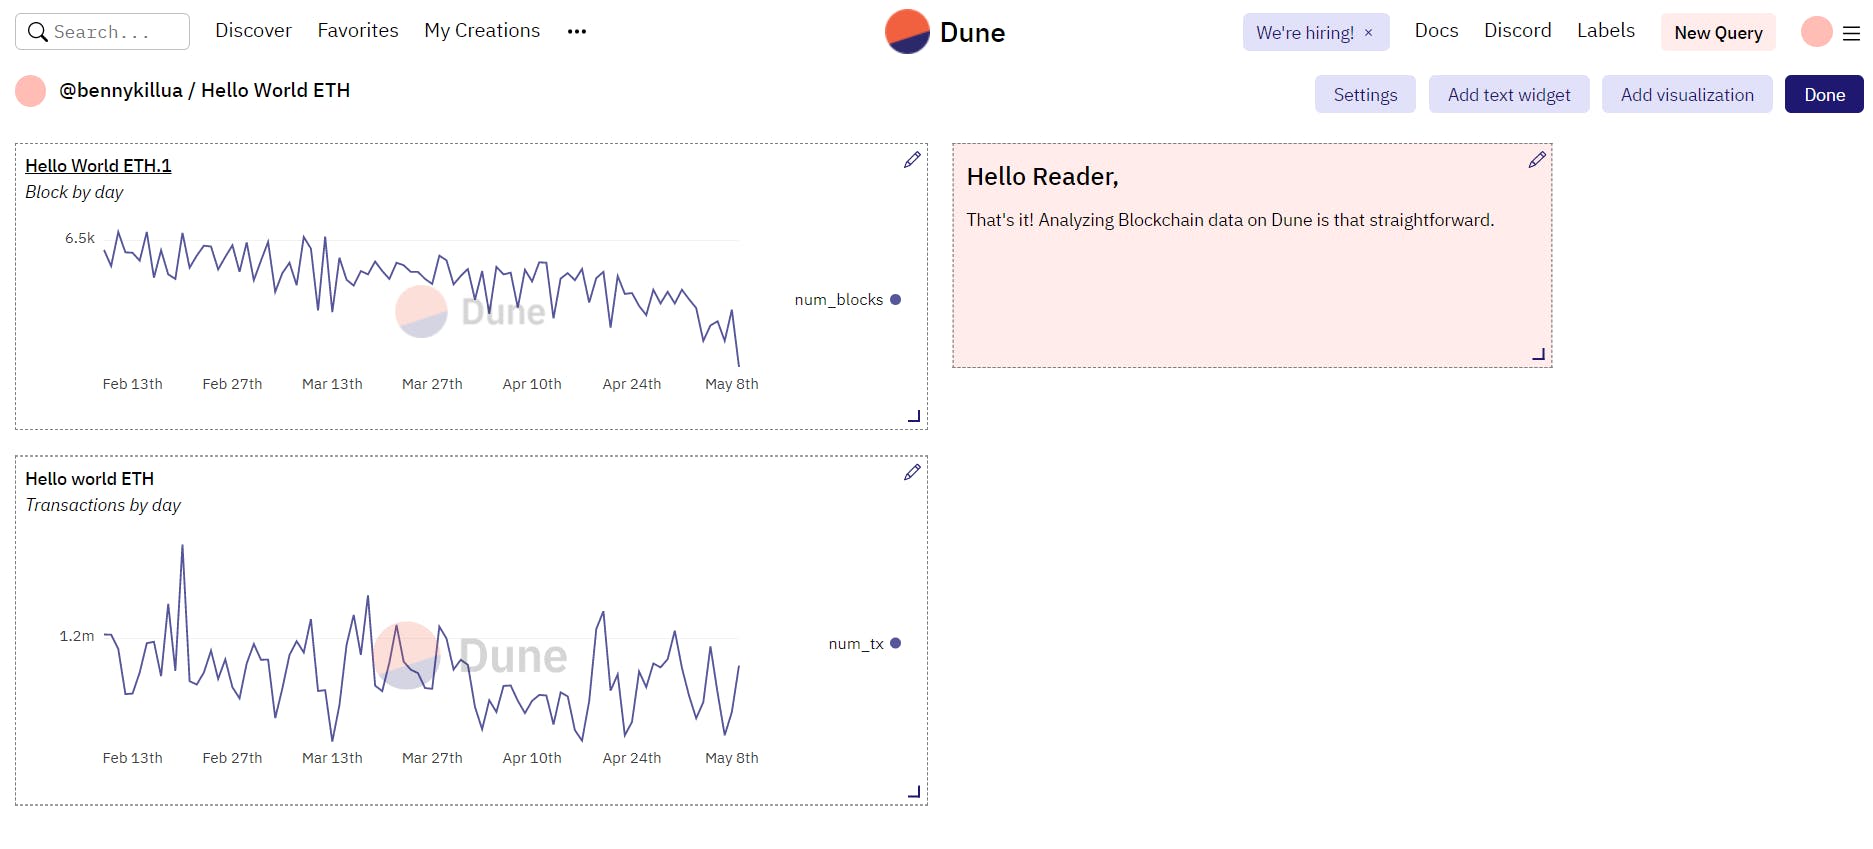
Here is the live dashboard and what the final output looks like:
It's worth mentioning that all queries and datasets on Dune are public by default. However, by purchasing a Pro Plan, you can have a private query or dashboard.
Summary and Next Steps
In this tutorial, you got to understand the Dune analytics interface and learned how to analyze blockchain data in Dune. You also discover that with a good understanding of SQL and the blockchain environment, you can analyze blockchain data on your own.
What should your next steps be? There's a lot to learn about the Blockchain ecosystem. So pick a project to analyze with Dune analytics, like a DeFi project or something on the BNB smart chain or Polygon blockchain.