Building Excel Spreadsheets Using Python
Write and visualize Excel spreadsheets with Python’s libraries

A teacher, learner, data analyst, technical writer and content creator.
I would be creating contents on data analysis, open source while explaining concepts of random exploration that piqued my interest 😅.
Happy Learning and Coding!
Original published on Section's Engineering Education (EngEd). you can explore the notebook on my Github.
One of the most intuitive and user-friendly ways to manipulate large datasets is using spreadsheets. As a result, there are a lot of spreadsheet packages available today. However, Microsoft Excel takes the lead as the most preferred spreadsheet package for analyzing datasets.
In the article, we will learn how to write and visualize Excel spreadsheets with Python's libraries OpenPyxl and XlsxWriter.
Table of contents
- Table of contents
- Prerequisites
- Getting Started with OpenPyxl and XlsxWriter
- Create, read, and load existing workbooks with OpenPyxl
- Basic excel operations with OpenPyxl
- How to visualize the dataset with OpenPyxl
- Create, read, and load existing workbooks with XlsxWriter
- Basic excel operations with XlsxWriter
- How to visualize the dataset with XlsxWriter
- Conclusion
- Further reading
Prerequisites
This tutorial assumes that you have the following:
- A basic understanding of Microsoft Excel.
- The Python programming language.
- An IDE (code editor); I would use a Jupyter notebook in this tutorial.
Here is a quick list of basic Excel's terminologies:
- Workbook/Spreadsheets - This is our Excel file.
- Sheet/worksheet - This is a page within the Excel file. We can have multiple sheets within the workbook.
- Column - This is the lettered vertical header. It starts from
AtoXFD. - Row - This is the numbered horizontal header. It starts from
1to1048576. - Cell - These are the rectangular boxes in the worksheet.
The cells are named according to the row's number and column's letter they meet. For example, the first cell in the worksheet is A1.
Getting Started with OpenPyxl and XlsxWriter
Just like every other library in python, we will begin with installing and importing the libraries before we get started.
Python's OpenPyxl and XlsxWriter modules allow us to read and modify Excel spreadsheet files. These libraries are helpful when it comes to automating python data to Excel.
However, unlike OpenPyXl, one can not read and update existing excel files.
To install these modules, enter the following into the interactive shell:
Installing OpenPyxl
pip install openpyxl
Installing XlsxWriter
pip install xlsxwriter
You should get no error message if the module is correctly installed.
However, if you have an error message, take a look at OpenPyXl and XlsxWriter documentation.
In the subsequent section, I will discuss how to create, read, and visualize data using OpenPyxl; then, I will move to XlsxWriter.
Create, read, and load existing workbooks with OpenPyxl
Openpyxl allows us to read/write Excel 2010 xlsx/xlsm/xltx/xltm files.
Once installed, we will create a simple spreadsheet using the following code:
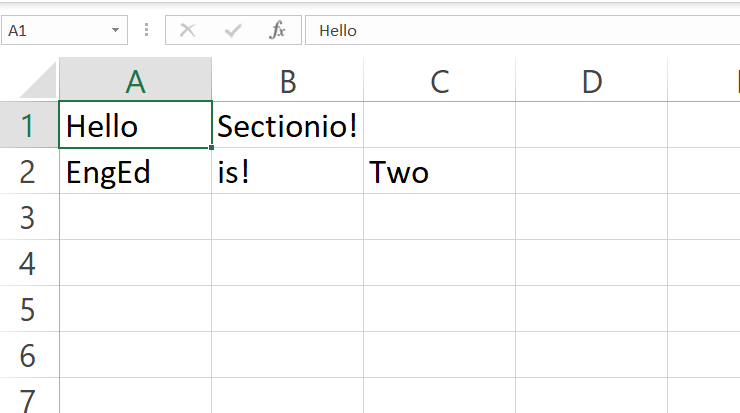
from openpyxl import Workbook  #importing our library

your_workbook = Workbook()    #creating the workbook
sheet = your_workbook.active
sheet["A1"] = "Hello"
sheet["B1"] = "Sectionio!"
sheet["A2"] = "EngEd"
sheet["B2"] = "is!"
sheet["C2"] = "Two"

your_workbook.save(filename="hello_world_openpyxl.xlsx") #saving the file with the 'xlsx' excel extension
 Screenshot by author
OpenPyxl allows us to load pre-existing workbooks. To follow along, you can download the dataset we will be using here. Use the load_workbook function to load this dataset.
from openpyxl import load_workbook

your_workbook2 = load_workbook('Test.xlsx')
print(your_workbook2.sheetnames)
your_workbook2.sheetnames tells us the available sheets in our excel workbook.
Basic excel operations with OpenPyxl
Once you have loaded your data, we will retrieve information from it. This can be done by calling the .value functions.
print(your_workbook2['Products']['A2'].value)
But, what if I want to read the whole workbook?
First, we would need to find out how many rows and columns the workbook has. This can be achieved using .max_row and .max_column functions.
row = your_workbook2['Products'].max_row
col = your_workbook2['Products'].max_column

print(row)
print(col)
Next, I would run two for loops; One would return every data on our rows, and the other would return data in our columns.
for i in range(1, row+1):
    for j in range (1, col +1):
        print(your_workbook2['Products'].cell(i, j).value)
Now, let's move to cell formatting.
Cell formatting customizes the look of the cell in the workbook. We would perform simple formatting on our loaded test workbook. But, first, we would create a worksheet object.
Wb = your_workbook2['Products']
Then, we would import PatternFill.
Pattern Fill allows us to change the colour and pattern of the cells. To define our PatternFill, we need to pass a pattern type and fgColor, which is a hex code.
You can get the hex code of any colour from Rapid tables.
from openpyxl.styles import PatternFill

first_style = PatternFill(patternType = 'solid', fgColor = '00FF00')
Wb['B7'].fill = first_style
Since we are changing the workbook, we have to save it once done running our code. So now, take a look at the spreadsheet. You will see the changes have been made to cell B7.
To save the spreadsheet, use .save() function:
your_workbook2.save(filename='Test.xlsx')
 Screenshot by author
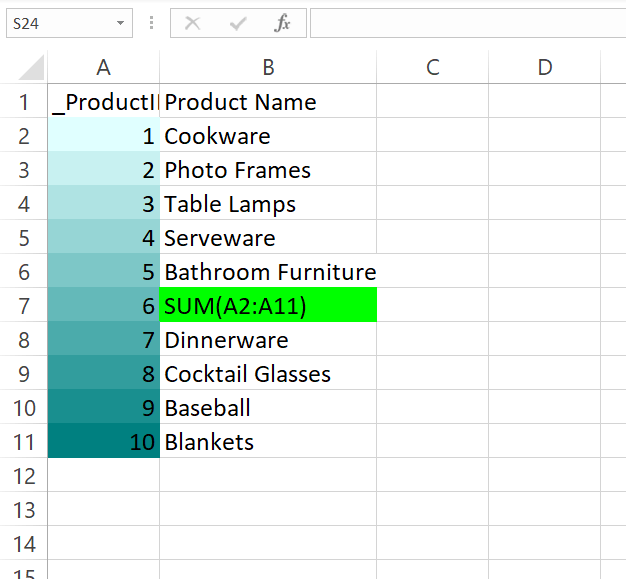
Conditional formatting differs from cell formatting because it allows us to highlight specific cells based on a condition. This draws our attention to specific cells and makes getting insights accessible.
I'll import the ColorScaleRule() to start the colour scale in Excel.
Colour scales are visual guides that help in understanding data distribution. The darker and lighter shade of the colour represents values at the extreme end.
from openpyxl.formatting.rule import ColorScaleRule

Condition_style = ColorScaleRule(start_type = 'min', start_color = 'E0FFFF', end_type = 'max', end_color = '008080')

Wb.conditional_formatting.add('A2:A11', Condition_style)

your_workbook2.save(filename='Test.xlsx')
 Screenshot by author
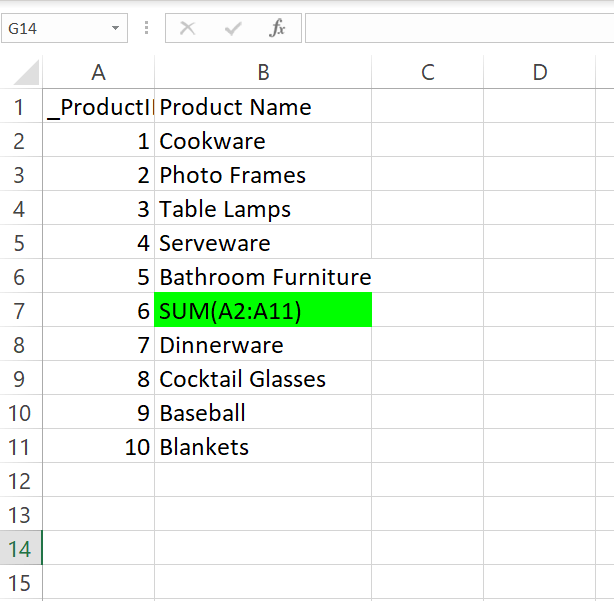
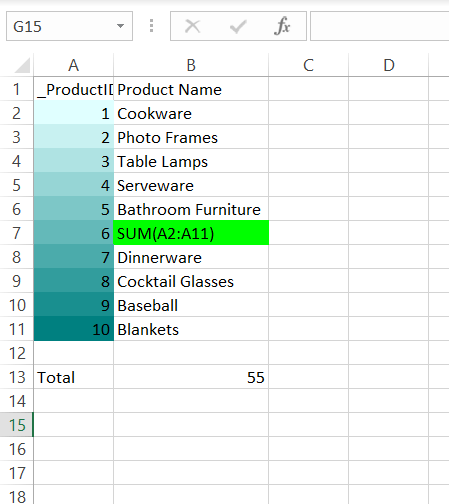
Finally, let's add up the numbers in the first column. To achieve this, we will enter the sum formula into a cell.
Wb['A13'] = 'Total'
Wb['B13'] = '=SUM(A2:A11)'
your_workbook2.save(filename='Test.xlsx')
 Screenshot by author
How to visualize the dataset with OpenPyxl
As humans, we internalize things quickly if we can see them visually.
Data visualization is the graphical representation of information. We can make more logical sense of a lot of information or data we come across today because of visual elements such as graphs.
OpenPyXL supports creating bar, line, scatter, and pie charts. We would visualize a bar chart using our loaded test workbook:
from openpyxl.chart import BarChart, Reference
Now, let's use these libraries and see how it plays out. Enter the code below into the interactive shell to create a bar chart:
sheet = your_workbook2.active

#we would give it the range of our data
values = Reference(sheet, min_col = 1, min_row = 1, max_col = 2, max_row = 11)

chart = BarChart()  # adding a bar chart
chart.add_data(values)
chart.title = 'BAR-CHART'    # giving the chart a title
chart.y_axis.title = 'Products'
sheet.add_chart(chart, "D2")  #D2 represent where we want the chart to start from/

your_workbook2.save(filename='Test.xlsx')
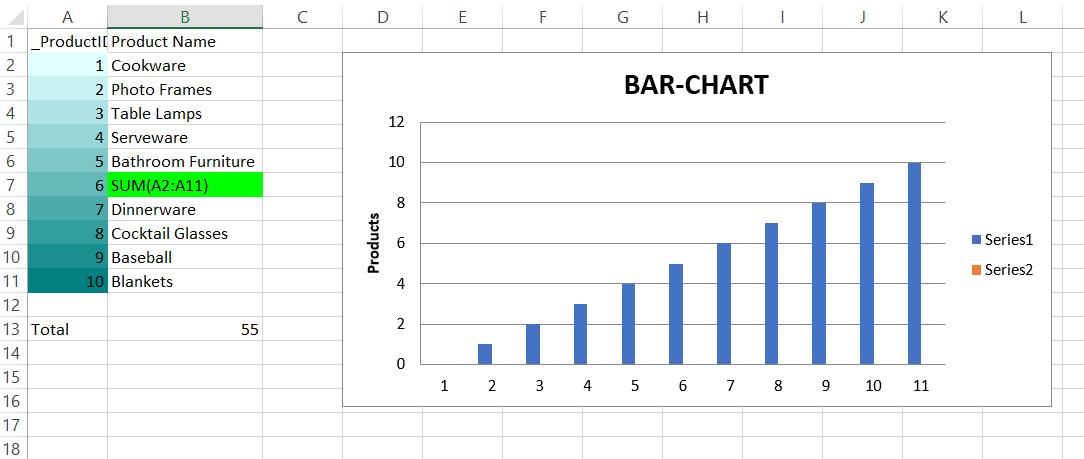 Screenshot by author
We've created a bar chart using BarChart(). We can also create pie charts, line charts and scatter charts using PieChart(), LineChart(), and ScatterChart().
Now, let's try all these out with XlsxWriter.
Create, read, and load existing workbooks with XlsxWriter
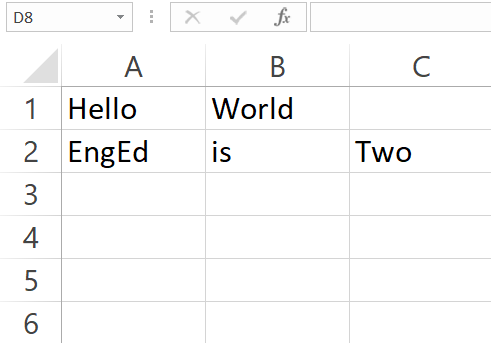
Earlier in this tutorial, we imported XlsxWriter. After importing, we will create a simple spreadsheet using the following code below:
import xlsxwriter #Importing our library

your_workbook = xlsxwriter.Workbook('hello_world_xlwt.xlsx')  #Creating the workbook
sheet1 = your_workbook.add_worksheet('Sheet 1')  #The add.worksheet() helps you add a worksheet into your excel files
The .write() function allows us to add data. It requires two things:
- The cell the data is to be entered on.
- The data to be entered.
sheet1.write('A1' , 'Hello')
sheet1.write('B1' , 'World')
sheet1.write('A2' , 'EngEd')
sheet1.write('B2', 'is')
sheet1.write('C2' , 'Two')

your_workbook.close() #once done, you close using .close
 Screenshot by author
We can also write the code above by specifying the row and column.
sheet1.write(0, 0 , 'Hello')  #Row 0 and column 0 which is A1
sheet1.write(0, 1, 'World')
sheet1.write(1, 0 , 'EngEd')
sheet1.write(1, 2, 'is')
sheet1.write(1, 3, 'Two')

your_workbook.close() #close the workbook
Unfortunately, XlsxWriter does not allow us to read and write to pre-existing Excel workbooks.
Basic excel operations with XlsxWriter
Let's try to perform some basic excel operations.
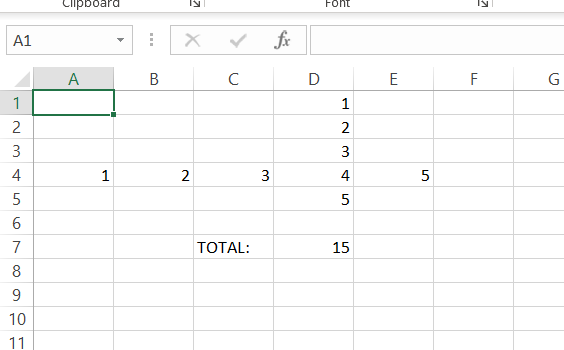
We start with a simple SUM operation.
Before we do that, we need to populate our worksheet with data using .write_column and .write_row.
The .write_column adds data to a column, while the .write_row adds data to a row. We only need to specify the start cell. This can be useful when building headers. After this, we add the data on Column D.
import xlsxwriter  #Importing our library

your_workbook = xlsxwriter.Workbook('hello_world_xlwt.xlsx')  #Creating the workbook
sheet1 = your_workbook.add_worksheet('Sheet 1')  #The add.worksheet() helps you add a worksheet into your excel files

sheet1.write_column('D1', [1, 2, 3, 4, 5]) #Adding data
sheet1.write_row('A4', [1, 2, 3, 4, 5])

sheet1.write('C7', 'TOTAL:')
sheet1.write('D7', '=SUM(D1:D5)')

your_workbook.close()
 Screenshot by author
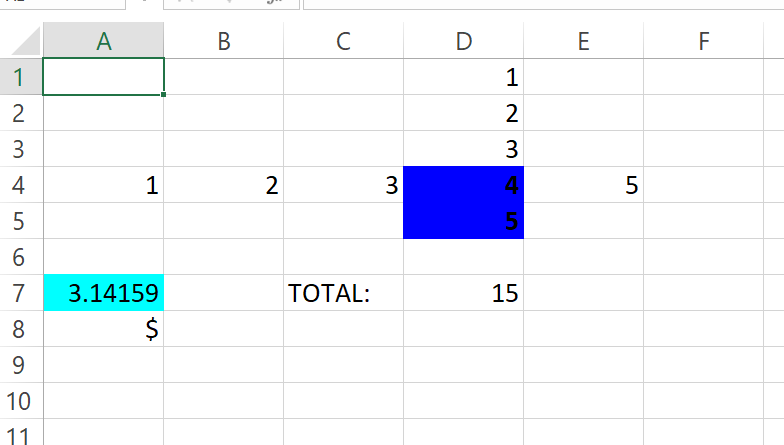
Let's do some formatting.
We can apply cell formatting by leveraging on themes. For example, one can create and store different theme JSON formats and apply them to your script.
Cyan_design = your_workbook.add_format({'bg_color' :  'cyan'}) #Creating a theme

sheet1.write('A7', '=PI()', Cyan_design) #Applying it on cell A7
We can use the code below to do conditional formatting. You will need to put this code and append the codes below right before you close the workbook.
Like I mentioned earlier, XlsxWriter does not allow us to read and write to pre-existing Excel workbooks.
oak_design = your_workbook.add_format({'bg_color' :  'green'',
                                       'font_name' : 'Century',
                                       'bold': True,
                                       'font_size' : 25 })

sheet1.conditional_format('D1:D5' ,
                                  { 'type' : 'cell',
                                   'criteria': '>',
                                   'value' : 3,
                                   'format' : oak_design})
Or a number format.
currency_format = your_workbook.add_format({'num_format': '$'})

sheet1.write('A8', 1234.56, currency_format)
 Screenshot by author
One thing to keep in mind is that Python has a function called help. This can be called using:
help(your_workbook.formats[0])
How to visualize the dataset with XlsxWriter
To make a pie chart, we'll use our knowledge of the earlier functions to build a dataset containing a list of West African countries and the number of states/regions.
import xlsxwriter

workbook= xlsxwriter.Workbook('hello_viz_xlwt.xlsx')
worksheet = workbook.add_worksheet()

headings = ['Countries', 'State_no']

Data = [['Benin', 'Burkina Faso', 'Cape Verde', 'Gambia', 'Ghana', 'Guinea', 'Guinea-Bissau', 'Ivory Coast',
         'Liberia', 'Mali', 'Mauritania', 'Niger', 'Nigeria', 'Senegal', 'Sierra Leone', 'Togo'],
        [10, 14, 24, 17, 16, 3, 19, 15, 9, 9, 8, 36, 14, 4, 5, 3]]
We would use the .write_row to create headings and .write_column for our data.
worksheet.write_row('A1', headings) #Write a row of data starting from A1 for our heading

# Write a column of data starting from A2, B2, C2 respectively.
worksheet.write_column('A2', Data[0])
worksheet.write_column('B2', Data[1])
Now, let's create a pie-chart.
Enter this interactive shell example to create a Pie chart using .add_chart({'type': 'pie'}) and add it to the spreadsheet using .insert_chart.
chart1 = workbook.add_chart({'type': 'pie'})

# Add our data series to our chart
chart1.add_series({
    'name':'Number of States/Regions',
     'categories':['Sheet1', 1,0,16,0],
     'values':['Sheet1', 1,1,16,1],
})

chart1.set_title({'name':'Number of States/Regions'}) #Chart title
chart1.set_style(10) #Chart style
worksheet.insert_chart('C2', chart1, {'x_offset':25, 'y_offset':10}) #insert chart to cell C2

workbook.close()
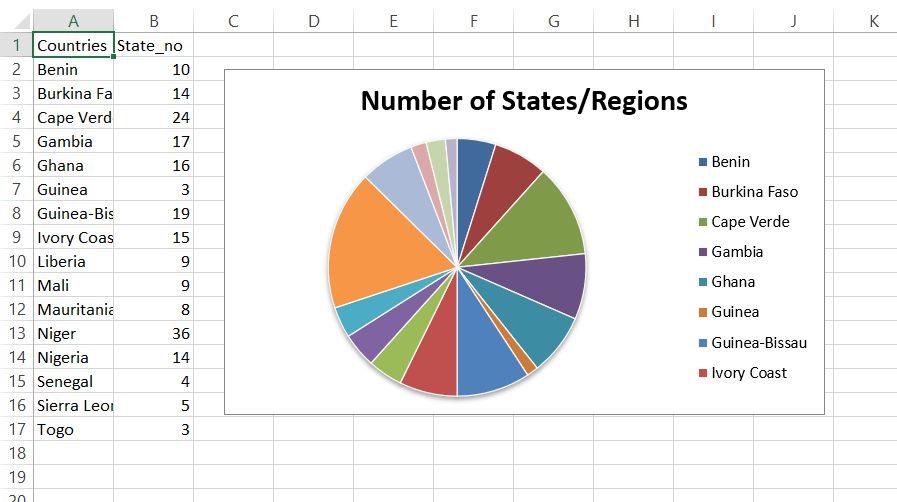 Screenshot by author
Conclusion
Although this tutorial covers some fundamentals of manipulating and visualization using this library, you can learn more about how these libraries work by visiting their official documentation.
Feel free to explore this notebook that I created as you follow the tutorial.
Happy coding.
Further reading
- Using Python pandas with Excel.
- Writing Excel sheet using Python.
- Build Smarter Spreadsheet with Python
- Data visualization using pandas
Peer Review Contributions by: Srishilesh P S


